Retail · Sales & Profitability
BrightMart Sales Analytics

Business Problem
BrightMart, a retailer operating across Atlantic Canada, needed to know how it could improve profitability — which regions, categories, salespeople, channels, and months actually drive performance, and where cost is quietly eating margin.
A retail sales analysis combining T-SQL aggregation in Microsoft Fabric with a Python/Jupyter exploratory notebook — covering revenue, cost, profit, margin, discounting, returns, and channel and segment behaviour.
Analysis Layers
6
KPI, region, category, salesperson, channel, month
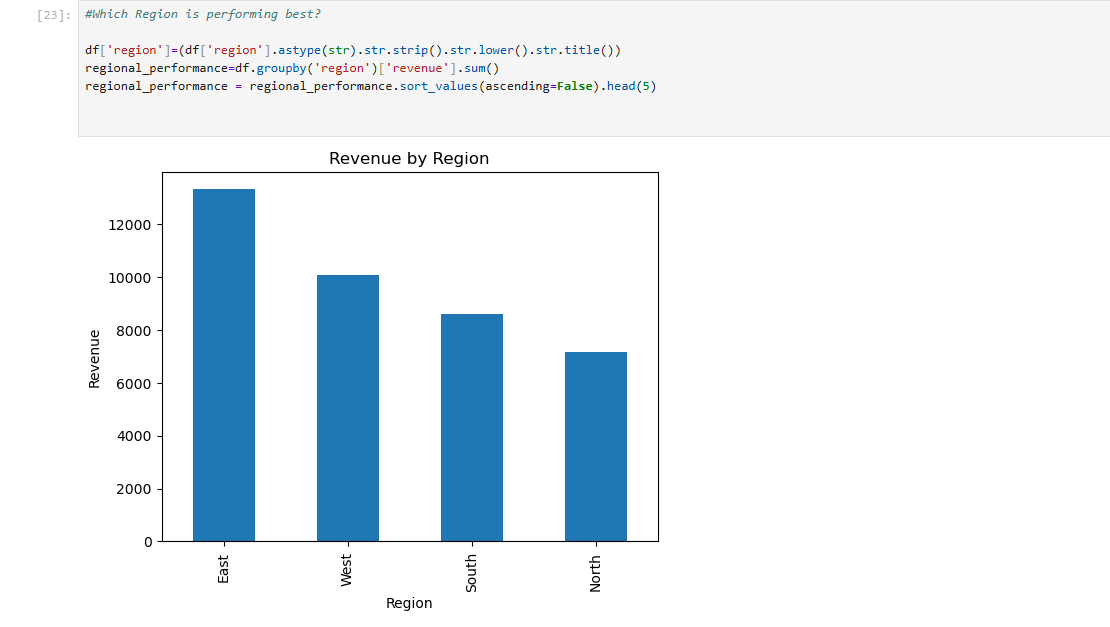
Top Region
East
highest total revenue
Top Category
Electronics
highest revenue, lowest margin
Highest Return Rate
Fashion
~22% of orders returned
Questions Answered
- Q01What are total orders, revenue, cost, profit, profit margin, average rating, and high-profit order count?
- Q02Which region performs best by total profit, and how do regions compare on revenue, orders, margin, and rating?
- Q03Which product category contributes the most profit, and which has the strongest margin?
- Q04Which salesperson should be recognized based on profit, revenue, margin, and customer rating?
- Q05Which sales channel is strongest across revenue, profit, margin, and rating?
- Q06Which month had the highest revenue, and which category drove it?
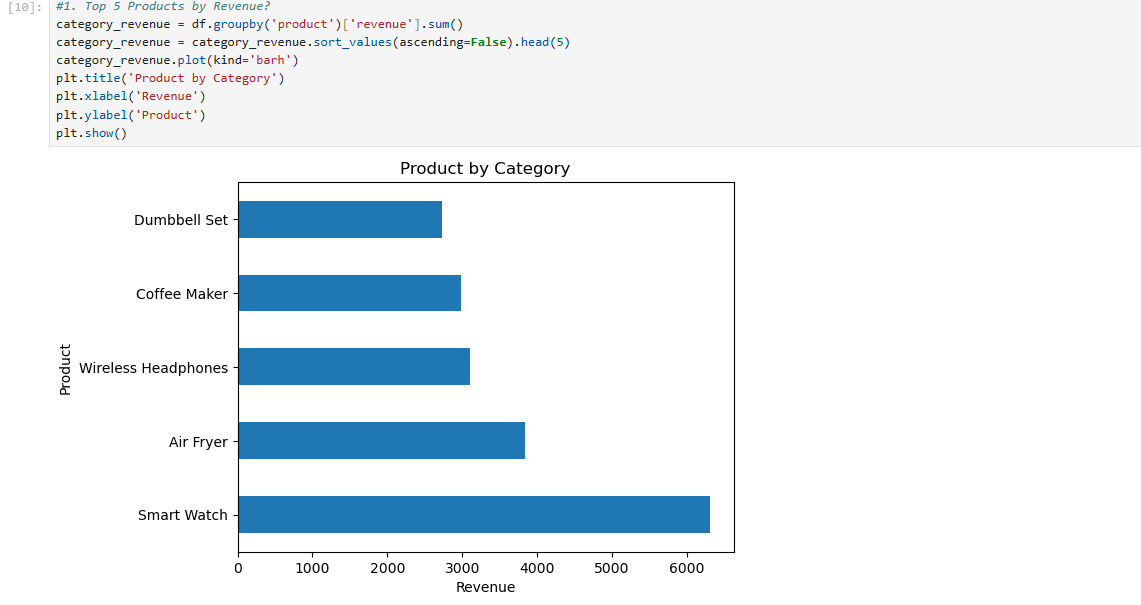
- Q07Which products generate the most revenue?
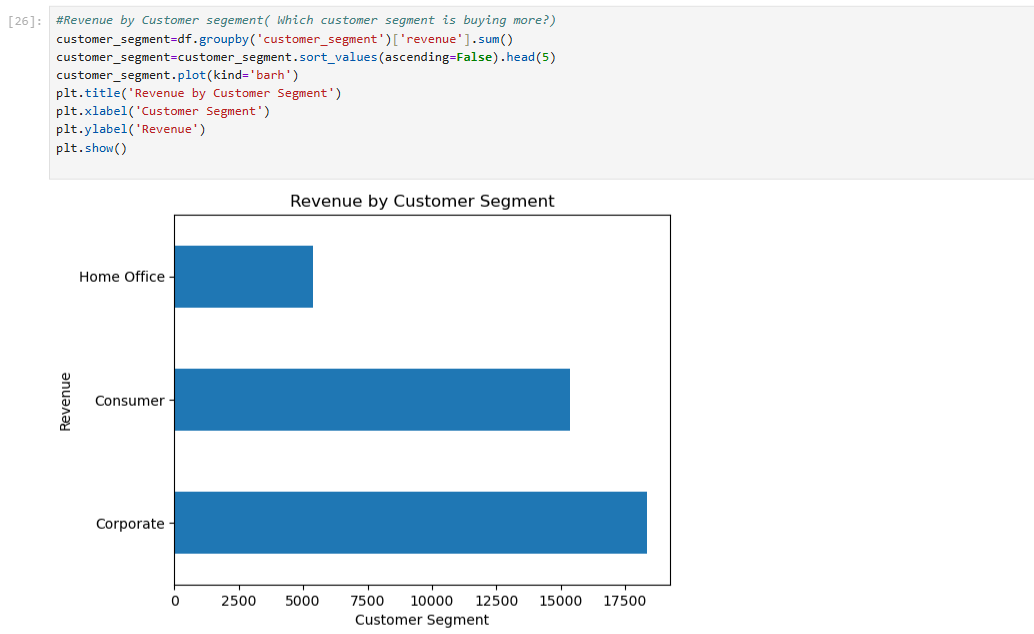
- Q08Which customer segment buys the most?
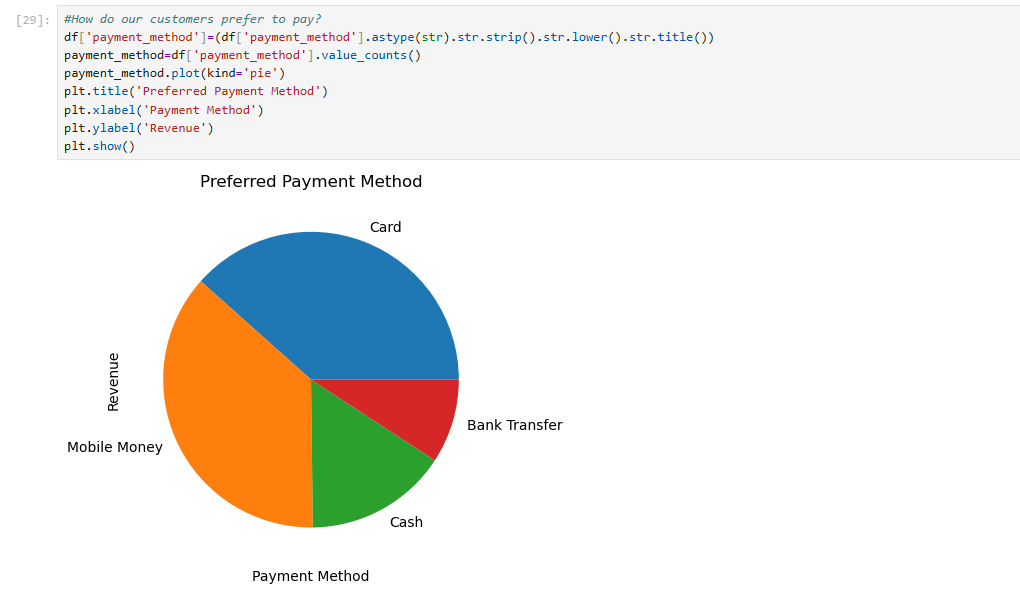
- Q09How do customers prefer to pay?
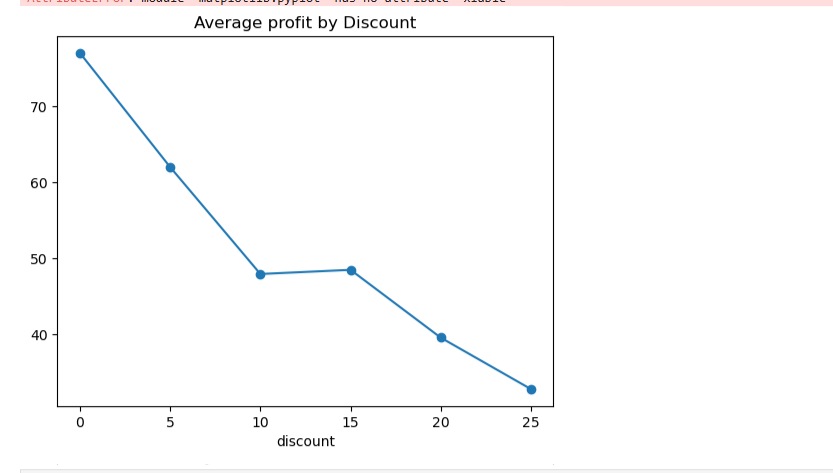
- Q10How does discounting affect average profit per order?
Approach
- 01
Loaded the BrightMart sales table into Microsoft Fabric and validated row counts and schema with T-SQL before any analysis.
- 02
Wrote grouped T-SQL queries for the executive KPI summary and for region, category, salesperson, and channel performance, adding a calculated profit-margin ratio to every rollup.
- 03
Pulled the dataset into a Python/Jupyter notebook with pandas for exploratory analysis, standardizing inconsistent category, region, and payment-method values (case and whitespace) that were splitting the same group into multiple rows.
- 04
Built Matplotlib visuals for revenue by category and product, regional performance, customer segment, payment mix, order-value distribution, discount sensitivity, and return rate.
- 05
Translated each output into a written business interpretation tied to the profitability question.
Key Metrics
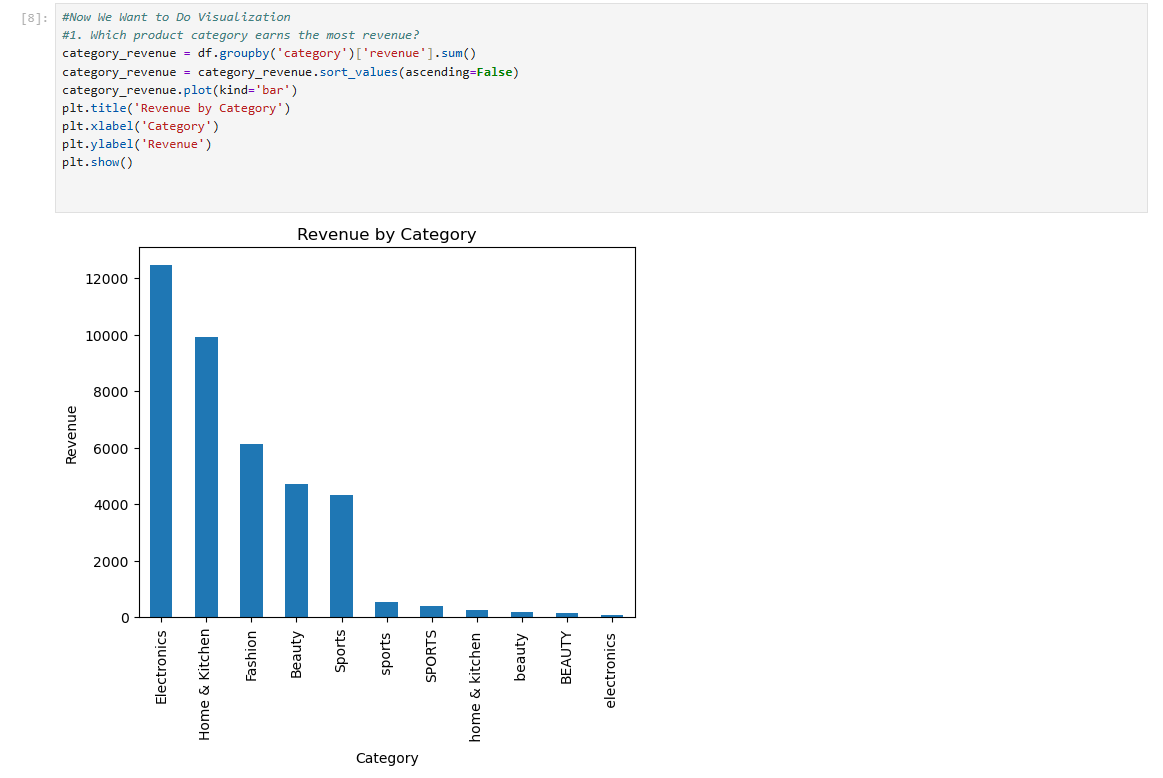
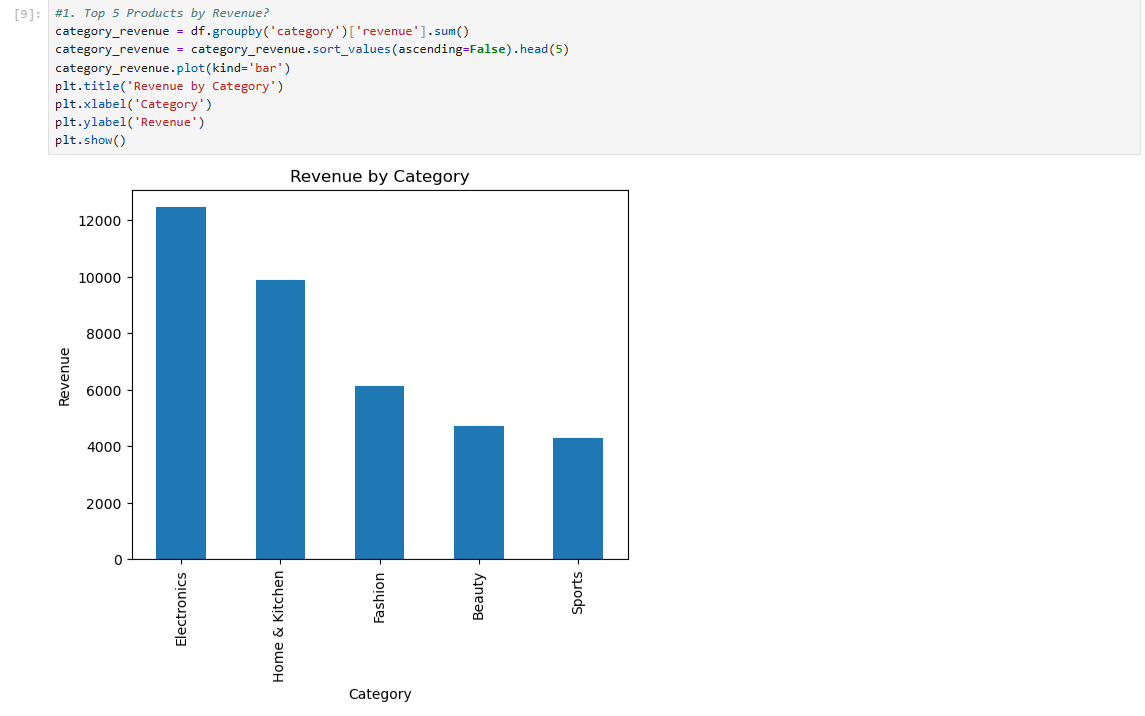
Revenue by Category
Electronics and Home & Kitchen lead category revenue.
Revenue by Region
East outperforms every other region on total revenue.
Average Profit by Discount Rate
Average profit per order falls steadily as discount depth increases.
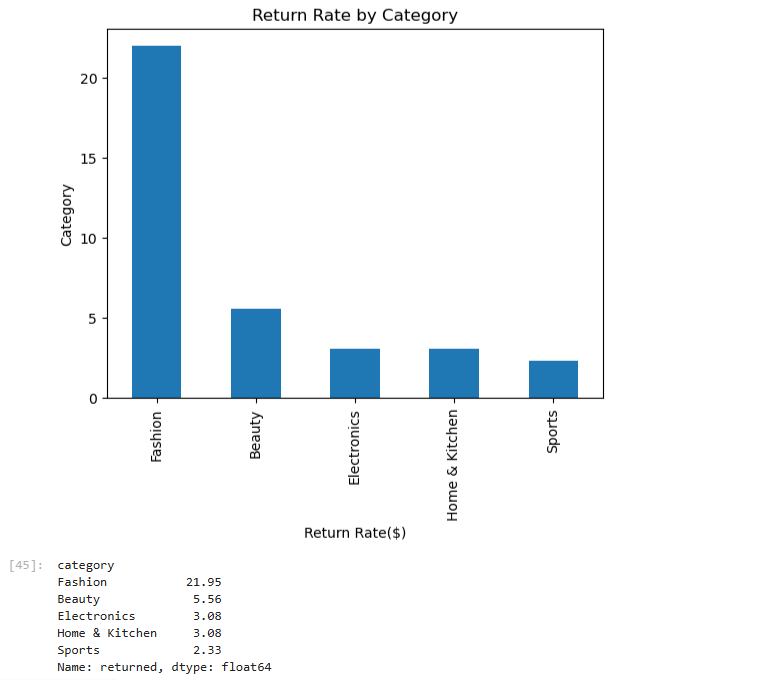
Return Rate by Category
Fashion returns dwarf every other category.
Dashboard Walkthrough
Findings & Insights
Cost, not pricing, compresses margin
Total profit is low relative to total revenue across the business, pointing to cost structure — vendor, logistics, or fixed overhead — rather than top-line demand as the profitability constraint.
High profit and high margin rarely coincide
The strongest region by total profit ranks near the bottom on margin, while the highest-margin region posts the lowest revenue. The same inversion appears across categories and salespeople.
Electronics sells, stationery earns
Electronics tops total profit with the weakest margin, while the lowest-revenue category holds the strongest margin — a mix problem, not a demand problem.
Discounting is expensive
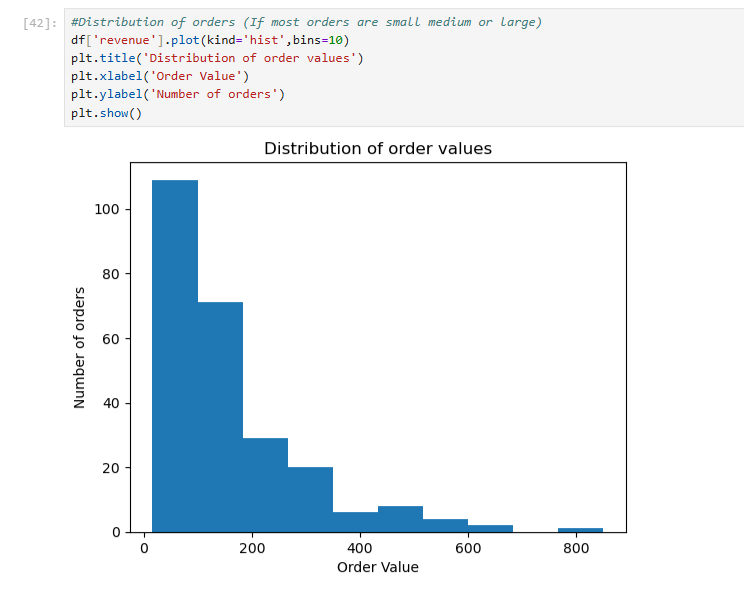
Average profit per order declines steadily with discount depth, with no offsetting volume lift visible in the order-value distribution.
Returns concentrate in Fashion
Fashion's return rate is far above every other category, meaning booked Fashion revenue overstates what the business actually keeps.
Dirty categorical fields distorted the first read
Case and whitespace variants in category, region, and payment fields fragmented groups until standardized — a reminder that cleaning changes conclusions, not just charts.
Recommendations
- Run a regional cost audit in the high-profit / low-margin region, starting with vendor pricing, transportation distance, and regional tax exposure.
- Re-price or re-position the lowest-revenue, highest-margin category rather than discounting it — there is margin room to buy demand.
- Cap discount depth around the point where average profit per order starts falling fastest, and require approval beyond it.
- Investigate Fashion returns at the sizing, description, and photography level before spending more on Fashion acquisition.
- Pair the top-profit salesperson's volume with the top-rated reps' service pattern; low customer ratings appear alongside margin loss.
- Enforce validation on categorical fields at ingest so category, region, and payment values arrive standardized.
Results & Findings
The analysis produced a six-query T-SQL performance summary plus a nine-visual Python notebook, framing BrightMart's profitability problem as cost structure, discount depth, category mix, and Fashion returns — each with a concrete follow-up for management.