Healthcare · OperationsFY2019 – FY2024
Healthcare Operations & Revenue Analysis
Business Problem
Leadership lacked a consolidated view of how patient admissions, medical conditions, medication use, and insurance billing interact — making it hard to explain why revenue moved and where claim denials were eroding margin.
A six-year Power BI analysis of patient demographics, admissions, medical conditions, medications, lab results, and insurance billing — built to answer ten stakeholder questions about care delivery and revenue performance.
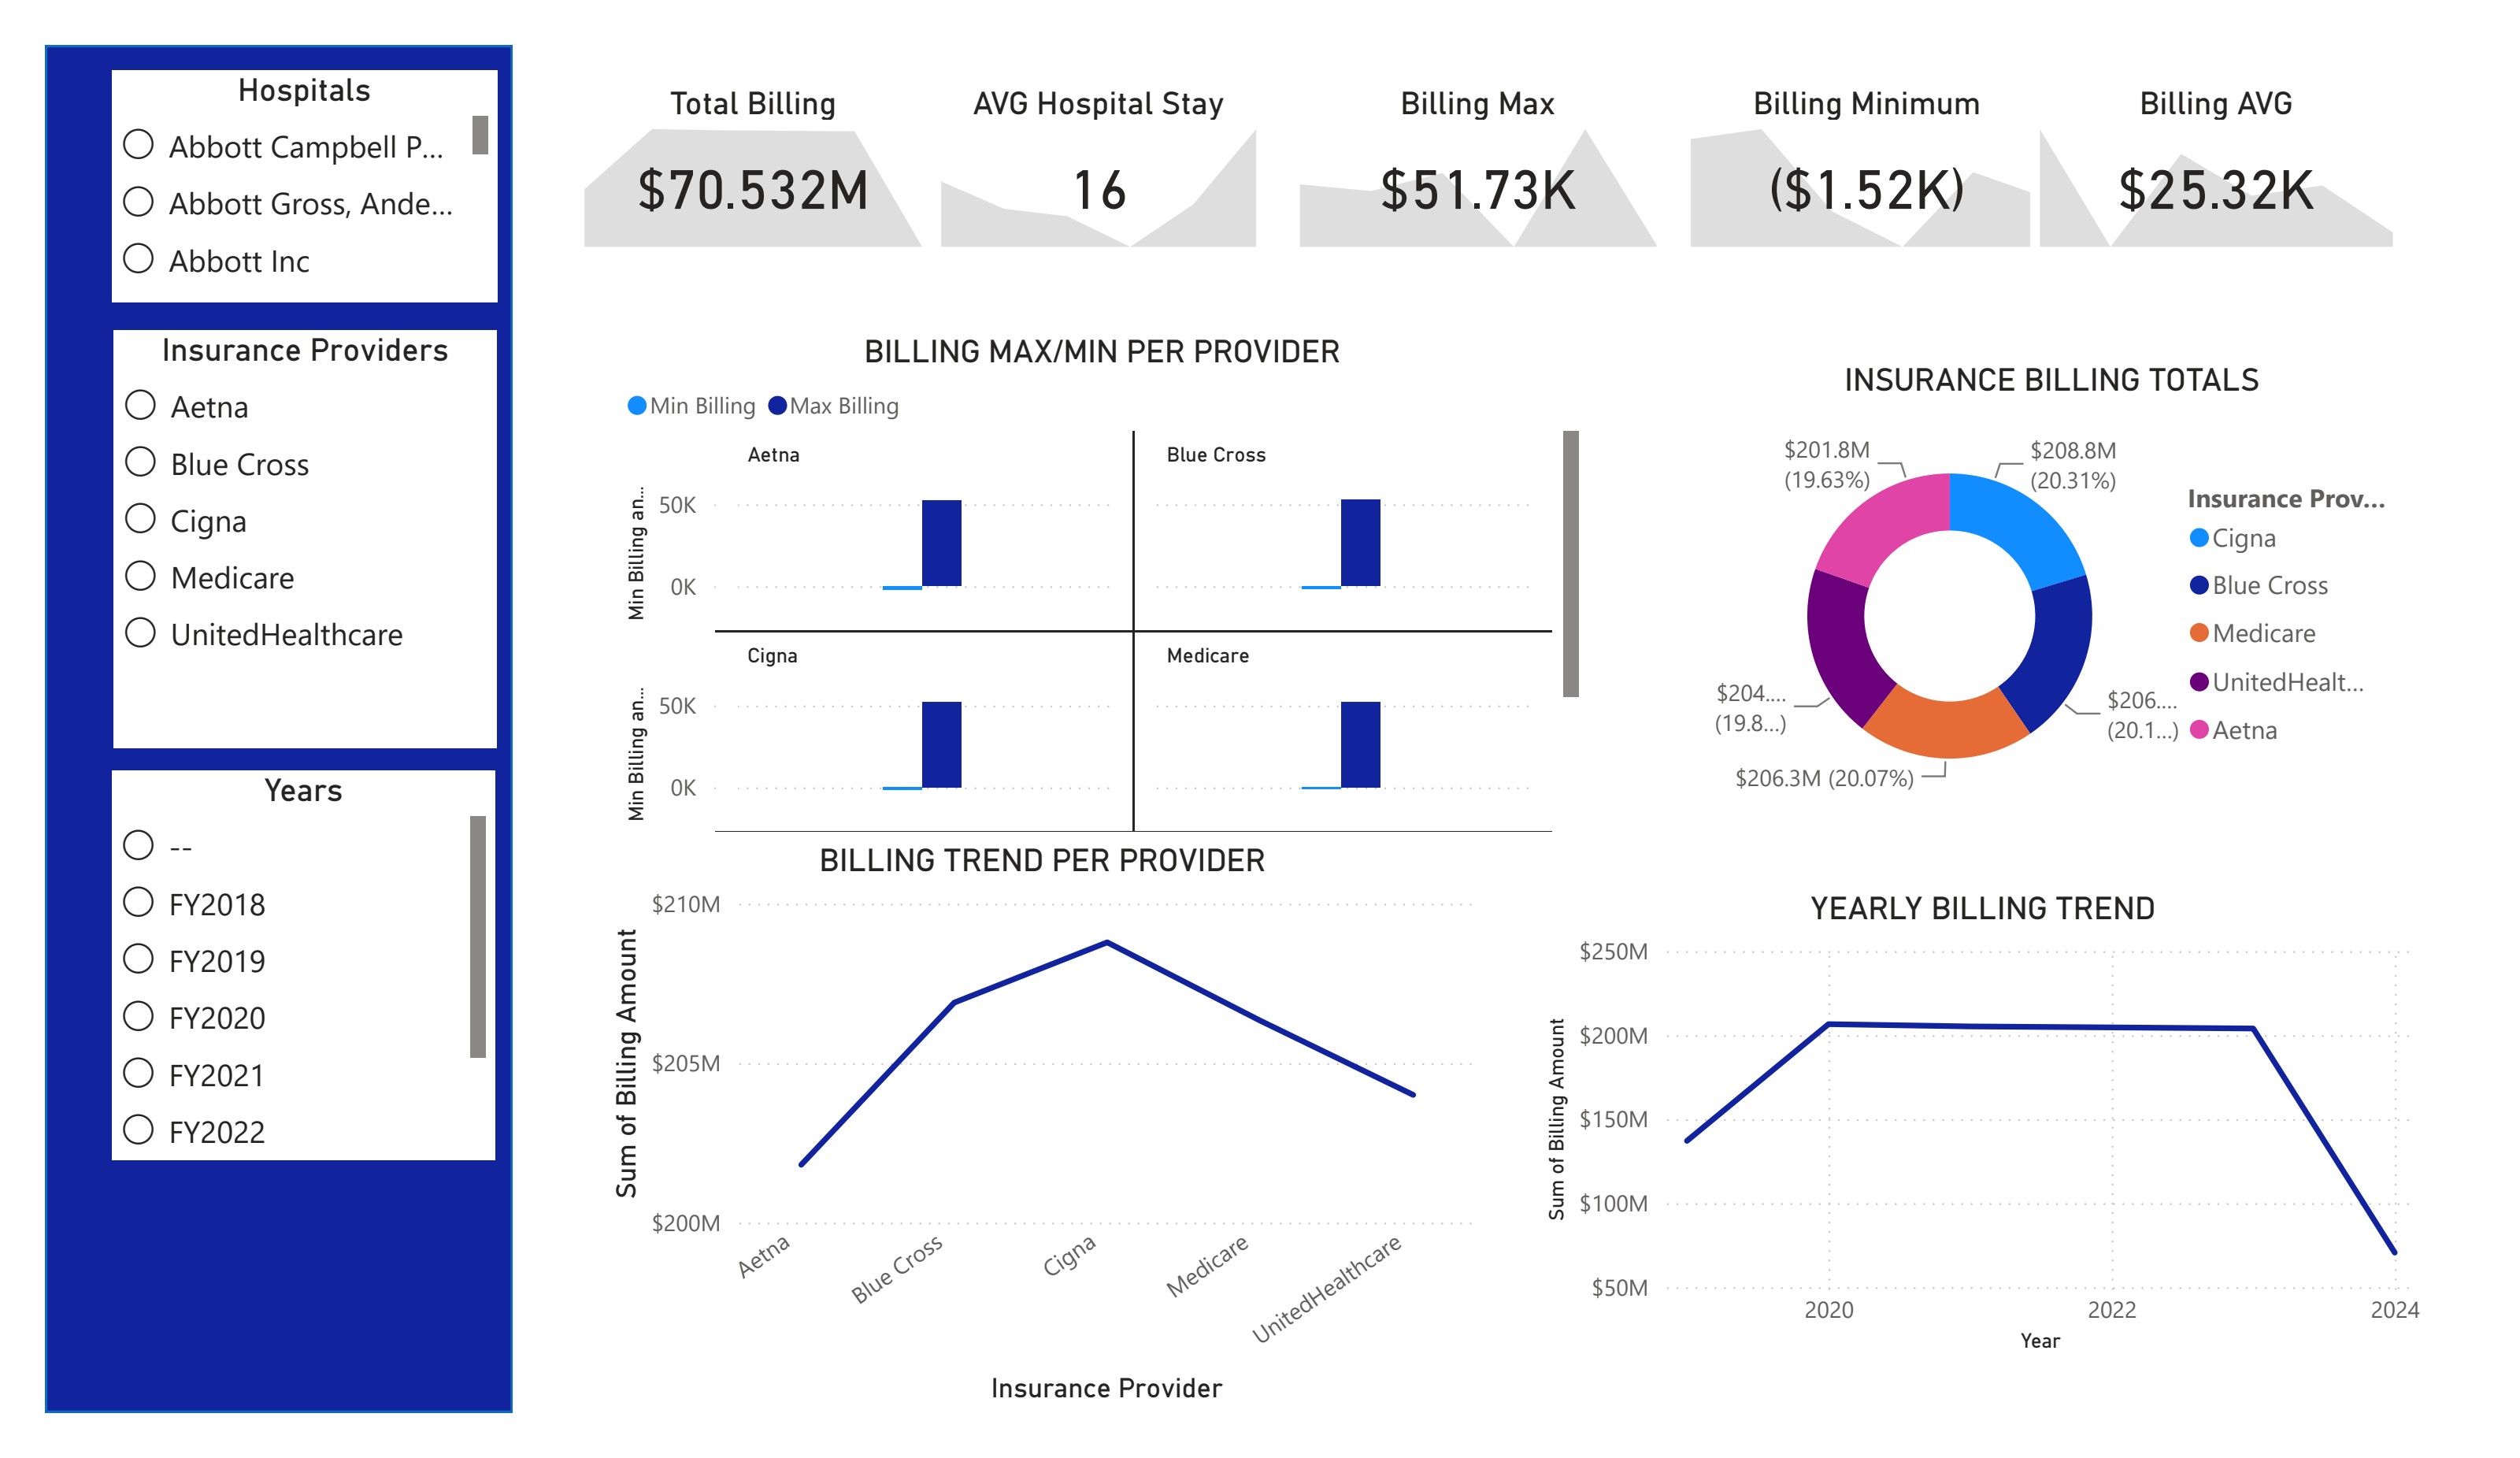
Total Billing
$1.03B
FY2019–FY2024 combined
Avg Hospital Stay
16 days
consistent across admission types
Avg Billing
$25.3K
per patient encounter
Billing Minimum
($1.52K)
negative values = denied claims
Questions Answered
- Q01How long does it take on average for a patient to be admitted and discharged?
- Q02Which age and gender groups have the most medical visits?
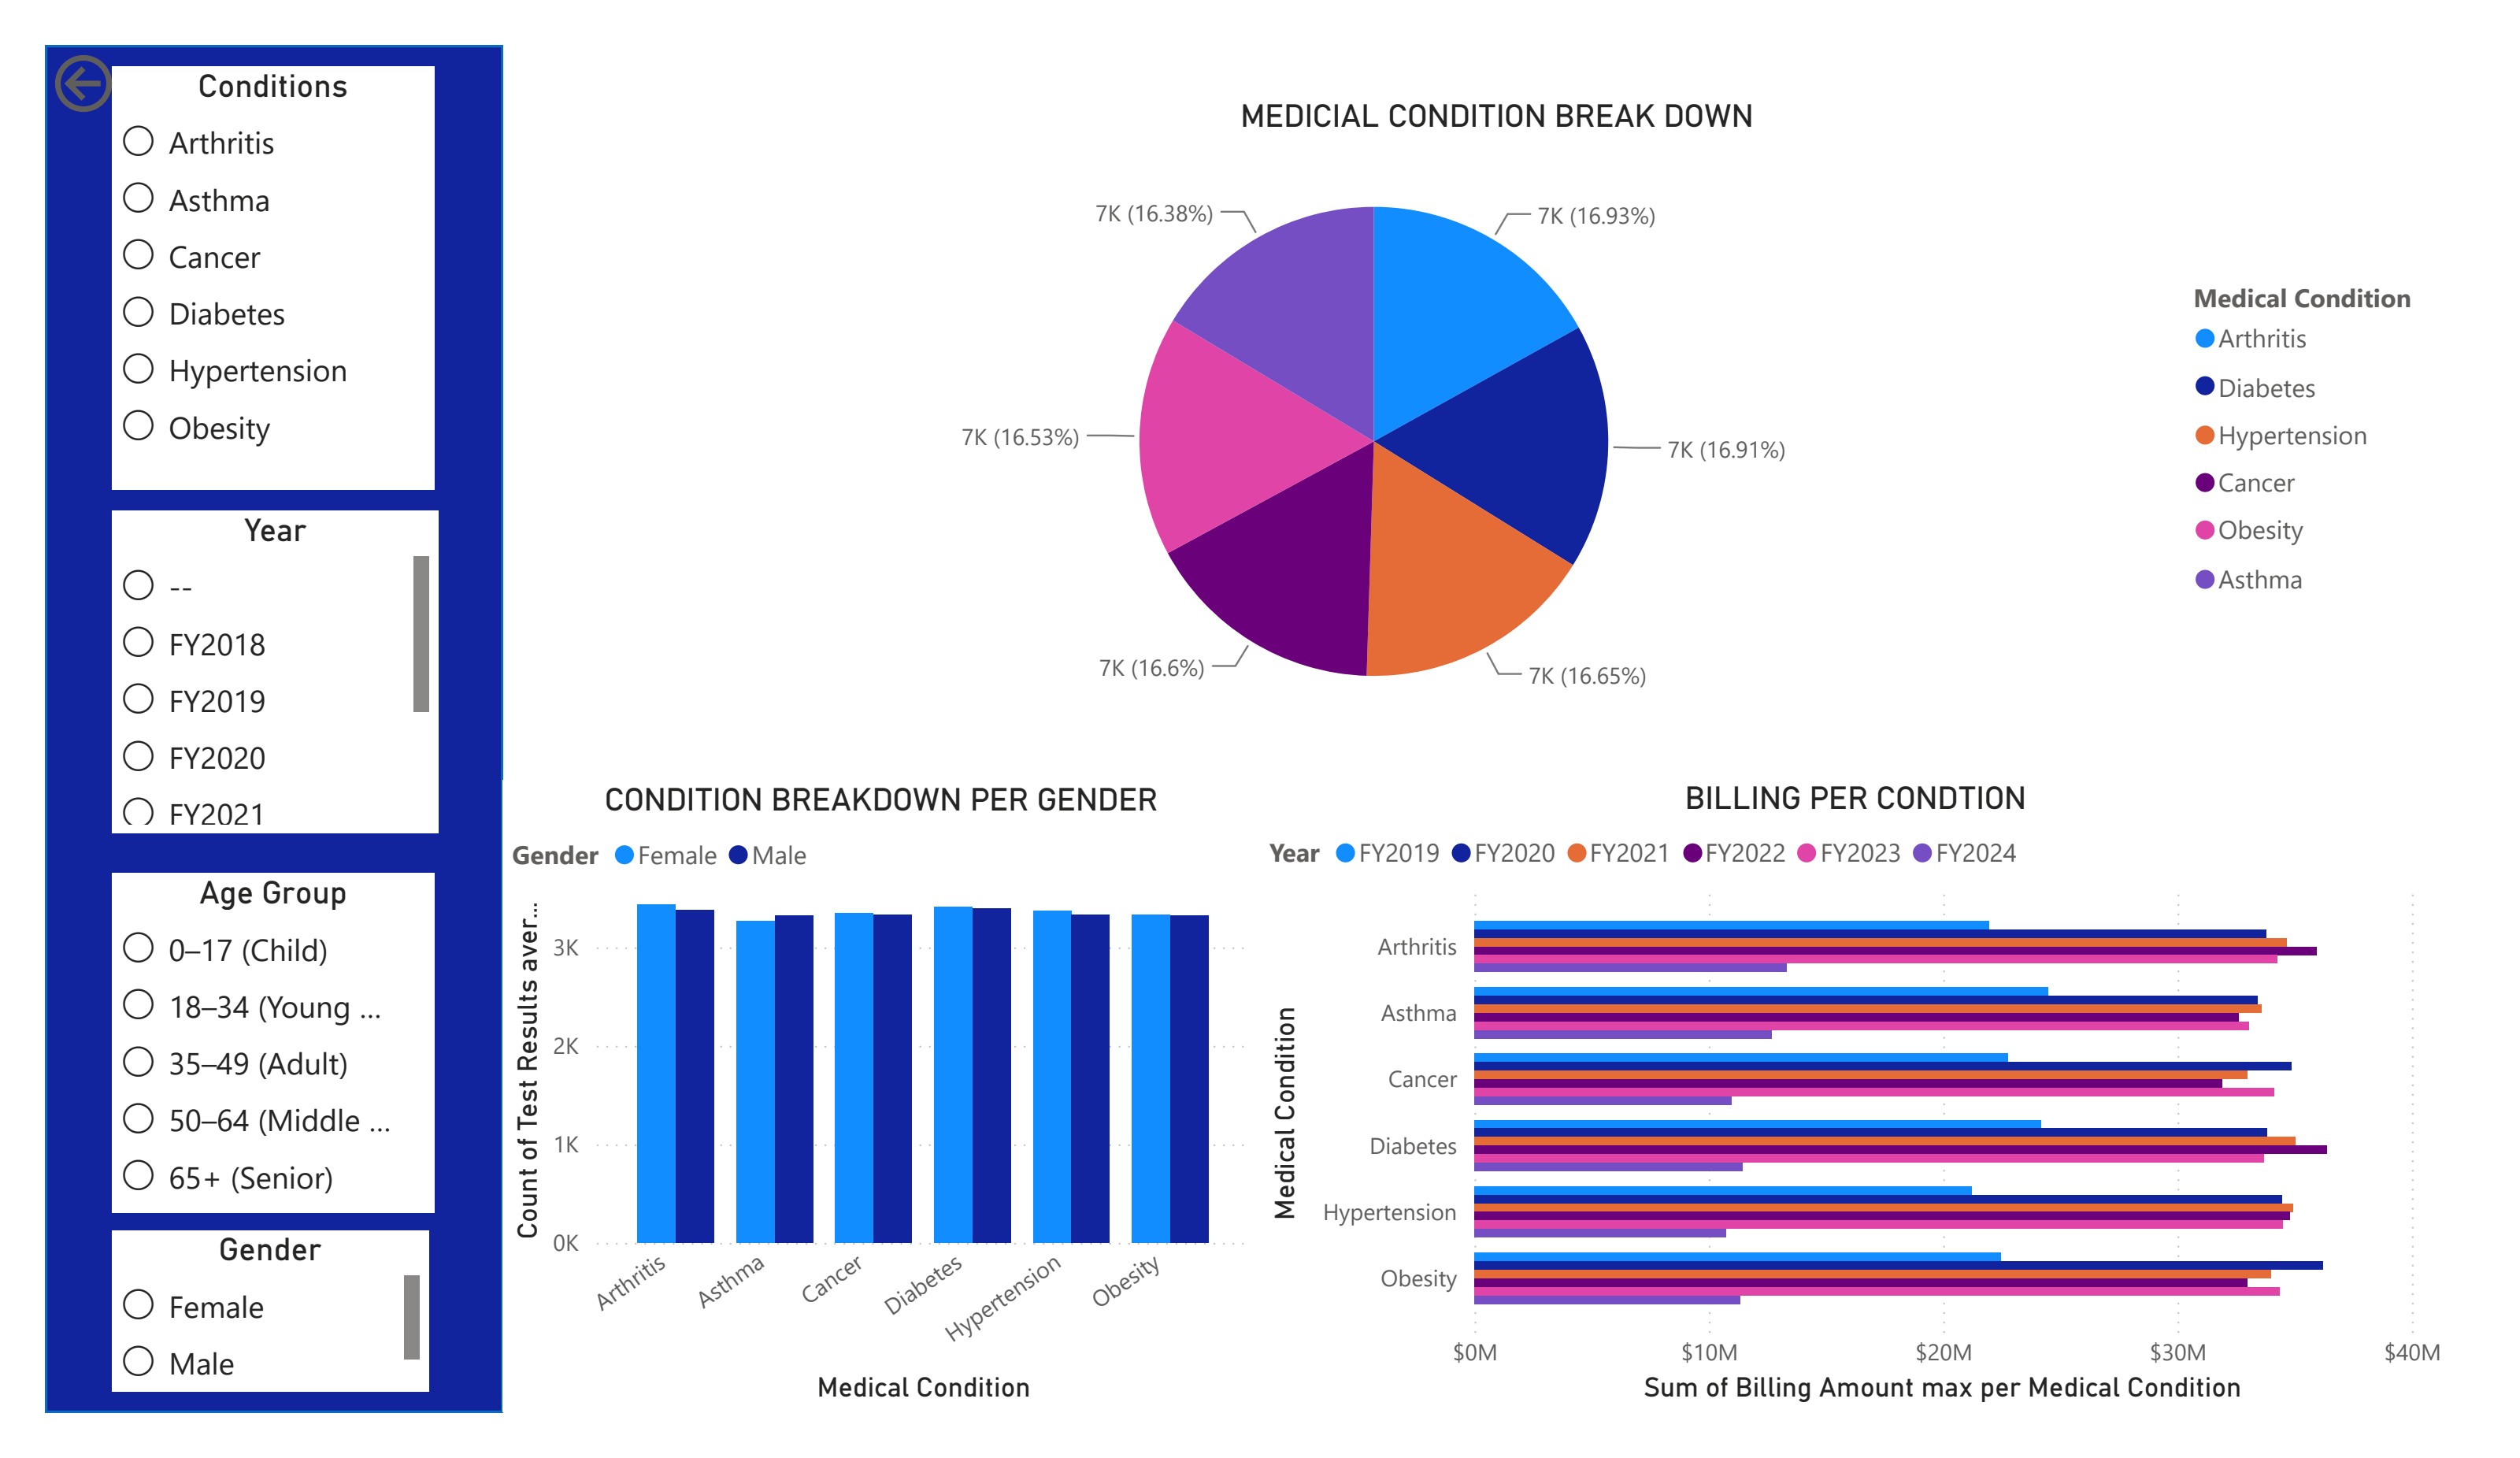
- Q03What medical condition is treated the most, and which bills the highest?
- Q04Which insurance providers bill the highest?
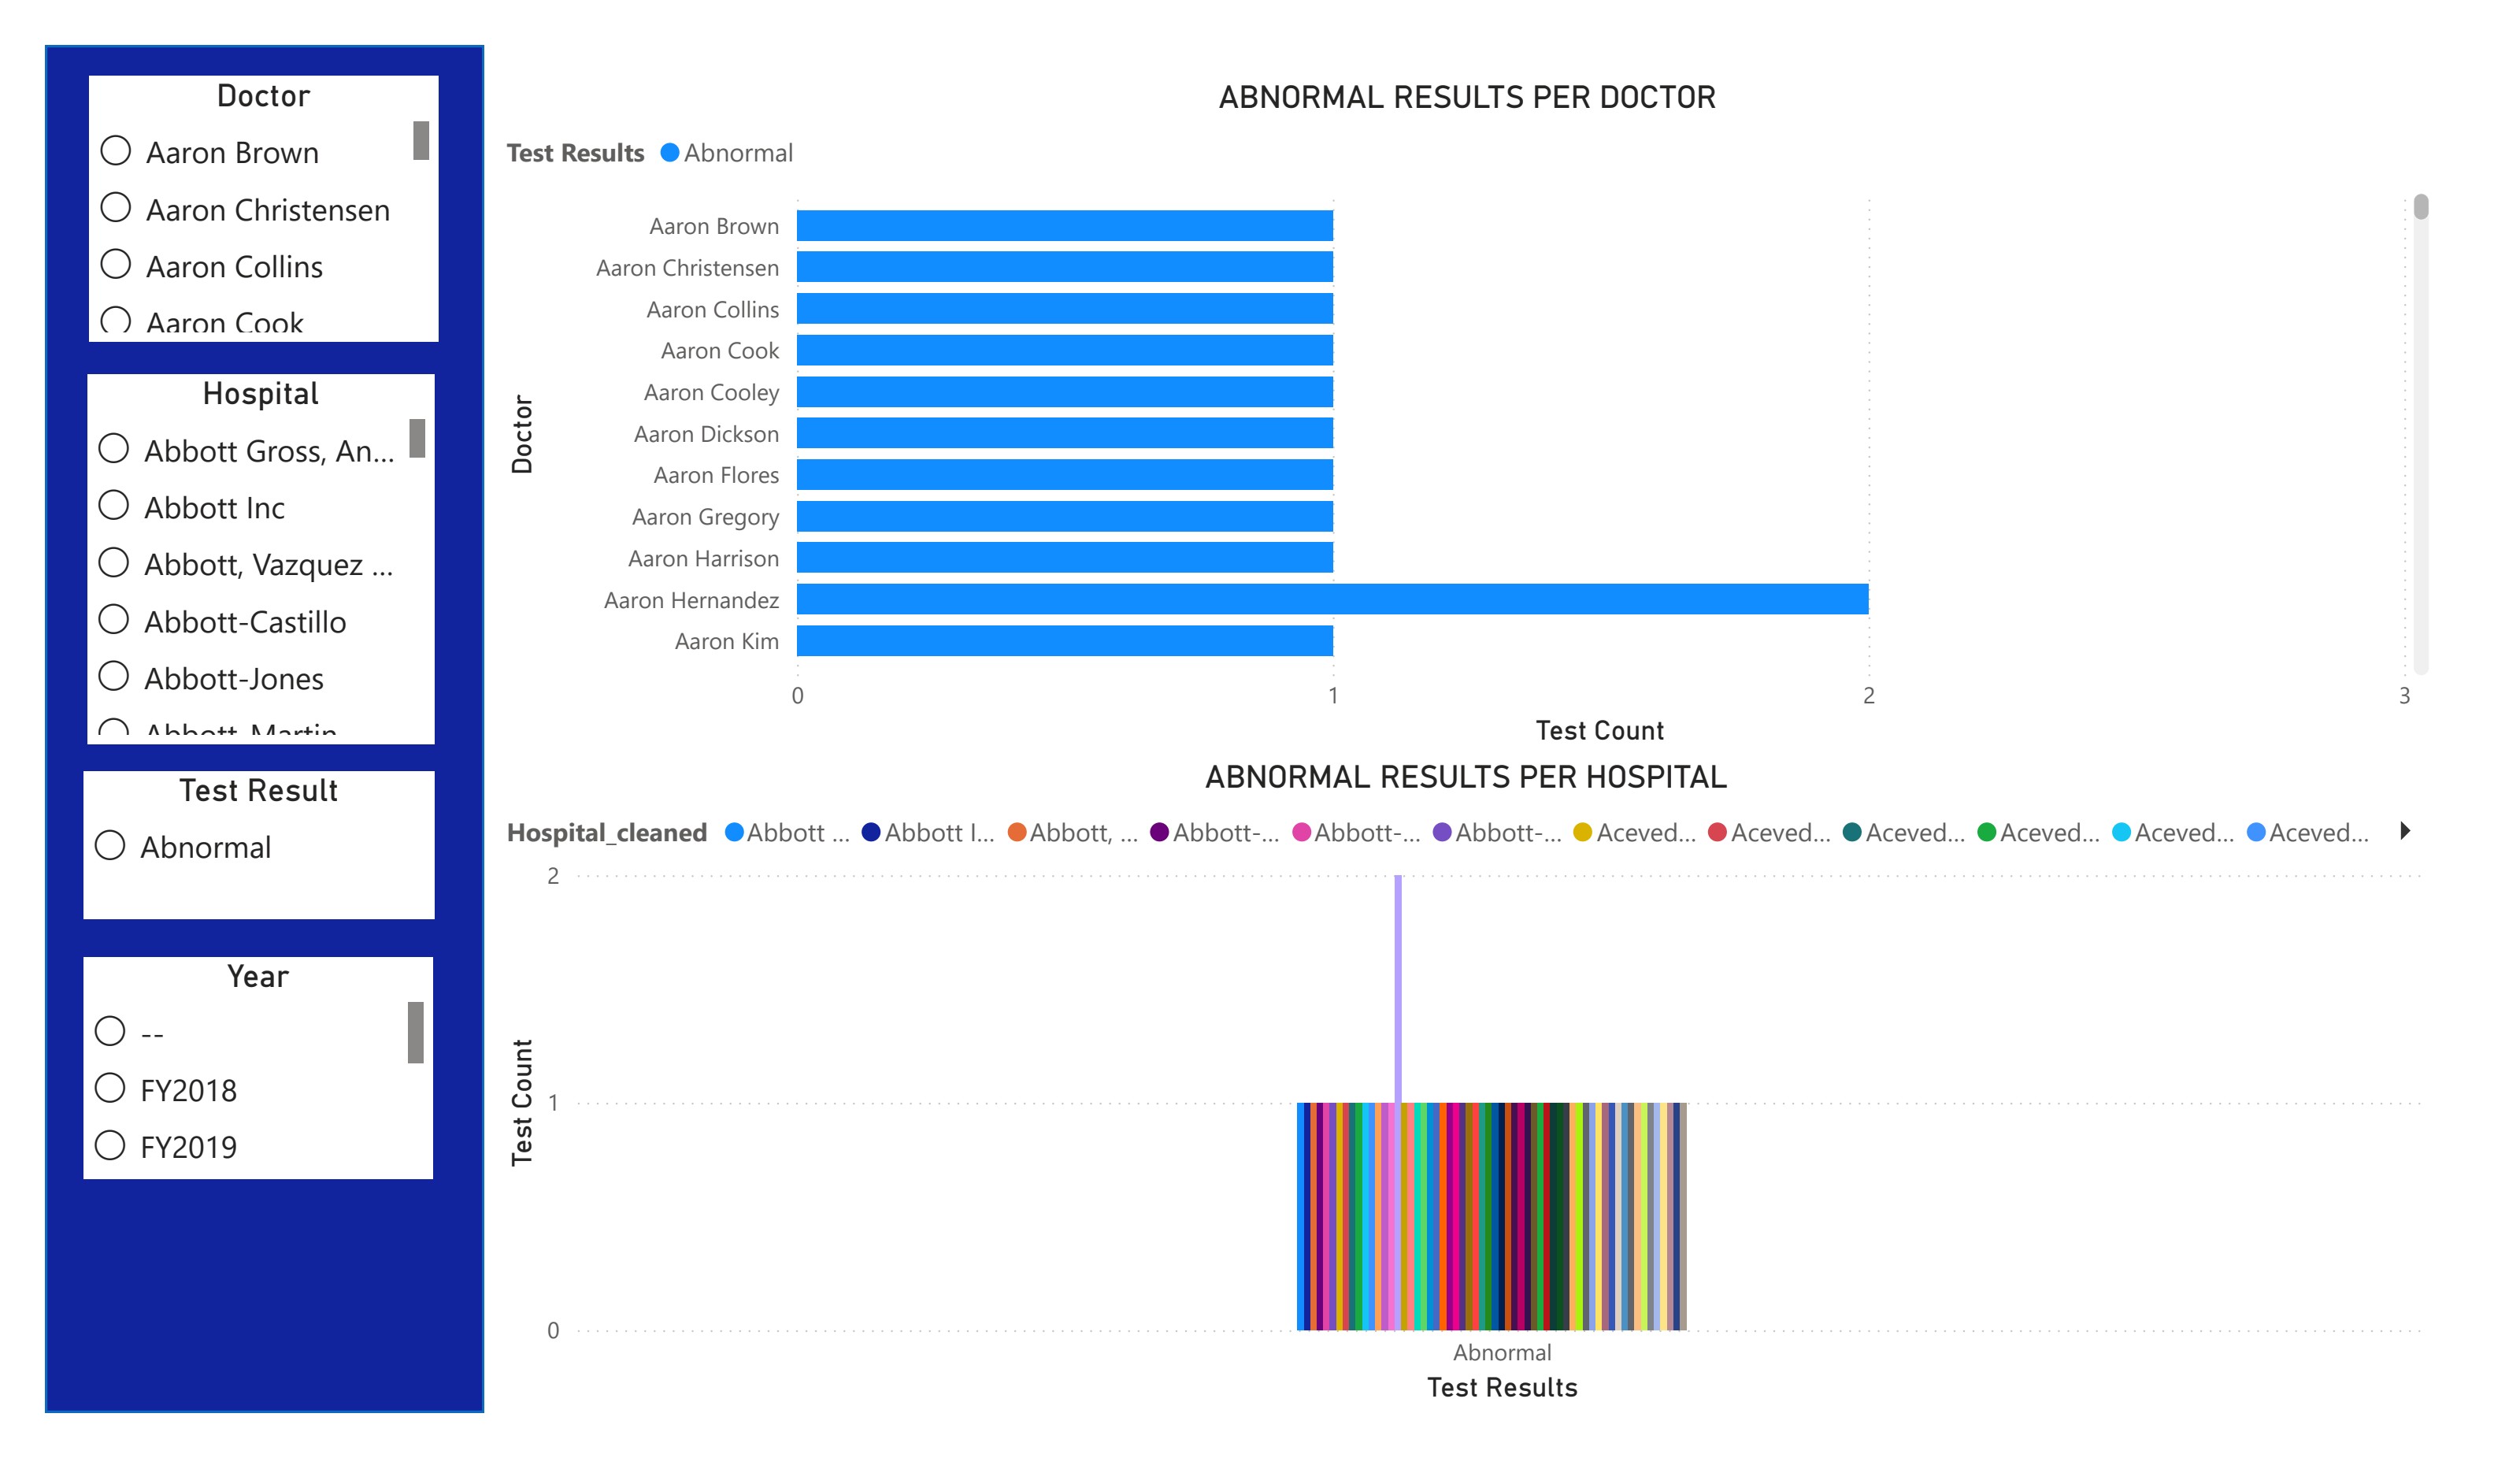
- Q05What is the abnormal testing average per gender, and which doctor generates the most abnormal results?
- Q06Are most patients elective, urgent, or emergency?
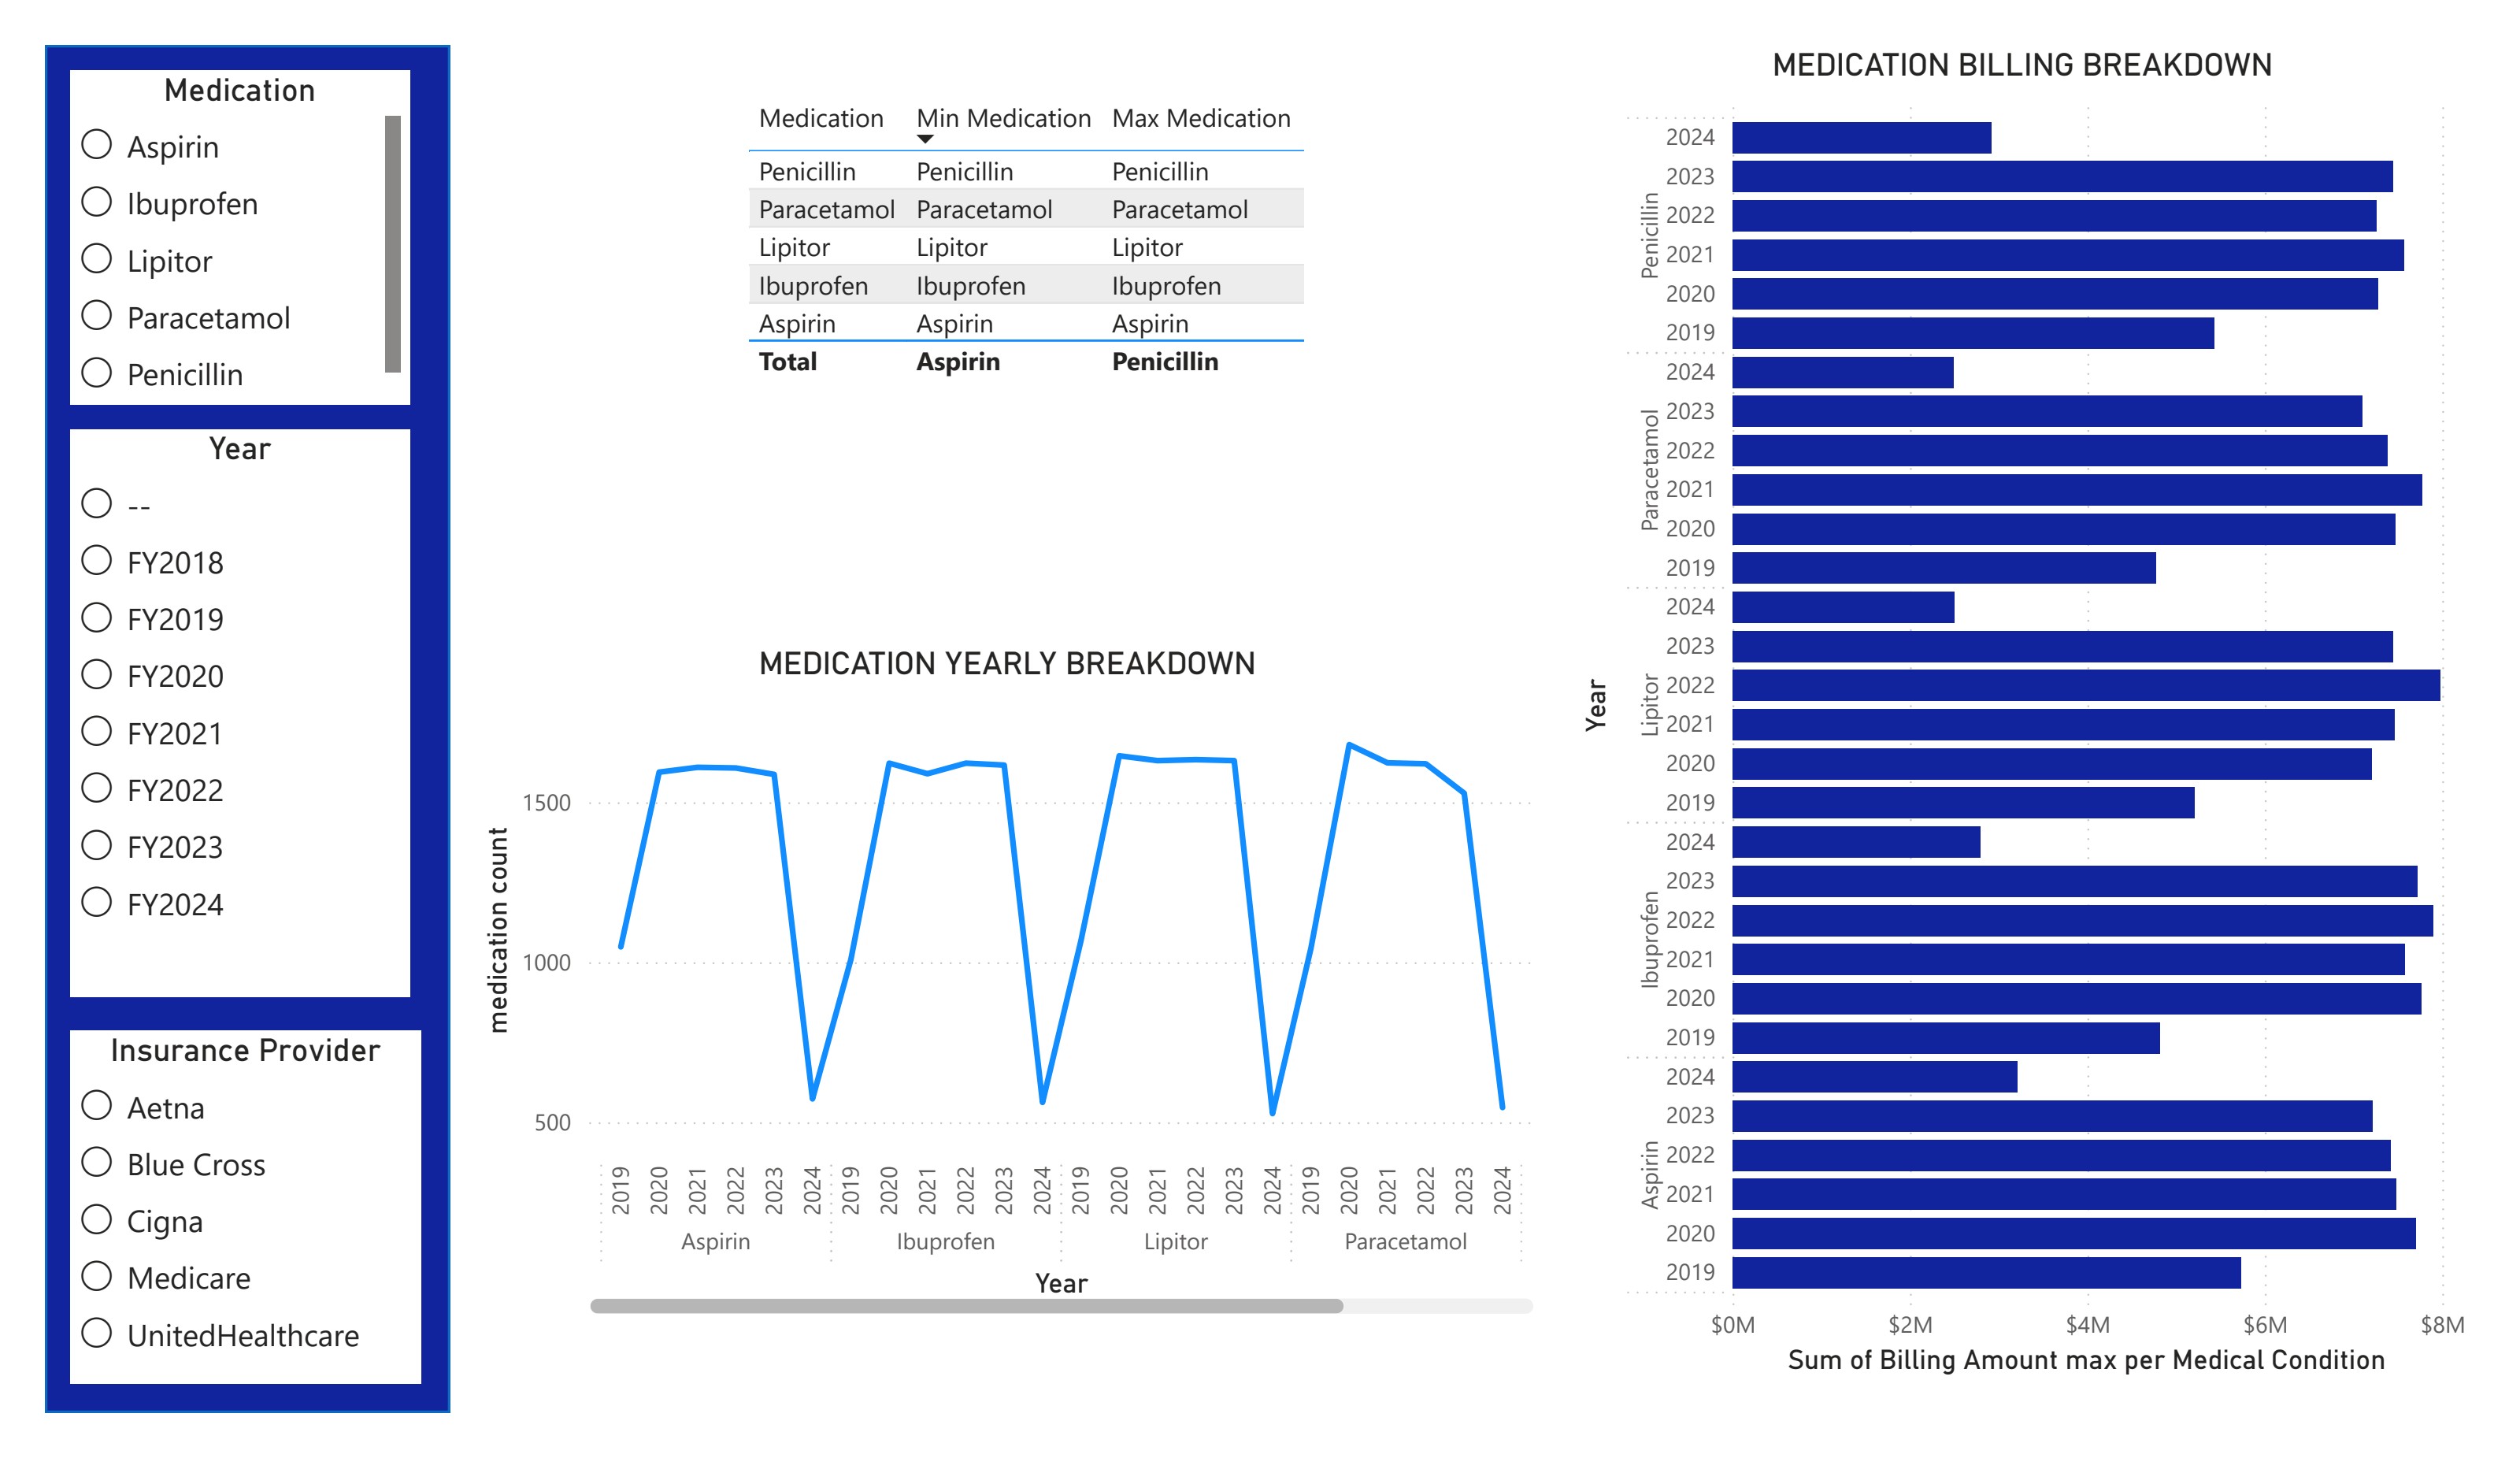
- Q07Which medication is prescribed the most?
- Q08Which hospitals handle the most patients?
Approach
- 01
Cleaned and modeled the source data in Power Query — standardizing hospital names, deriving a length-of-stay column, and building an age-group column for demographic segmentation.
- 02
Constructed a date table for time intelligence, enabling annual, quarterly, and monthly views across FY2019–FY2024.
- 03
Wrote DAX measures for patient counts, min/max billing, min/max stay, medication counts, and abnormal test counts.
- 04
Built six report pages — billing & insurance, admissions, hospitals, medications, medical conditions, and test results — each with slicers for hospital, provider, gender, age group, and fiscal year.
Key Metrics
Billing by fiscal year
Revenue rose into FY2020, held near $205M through FY2023, then fell to roughly $70M in FY2024.
Patient count by fiscal year
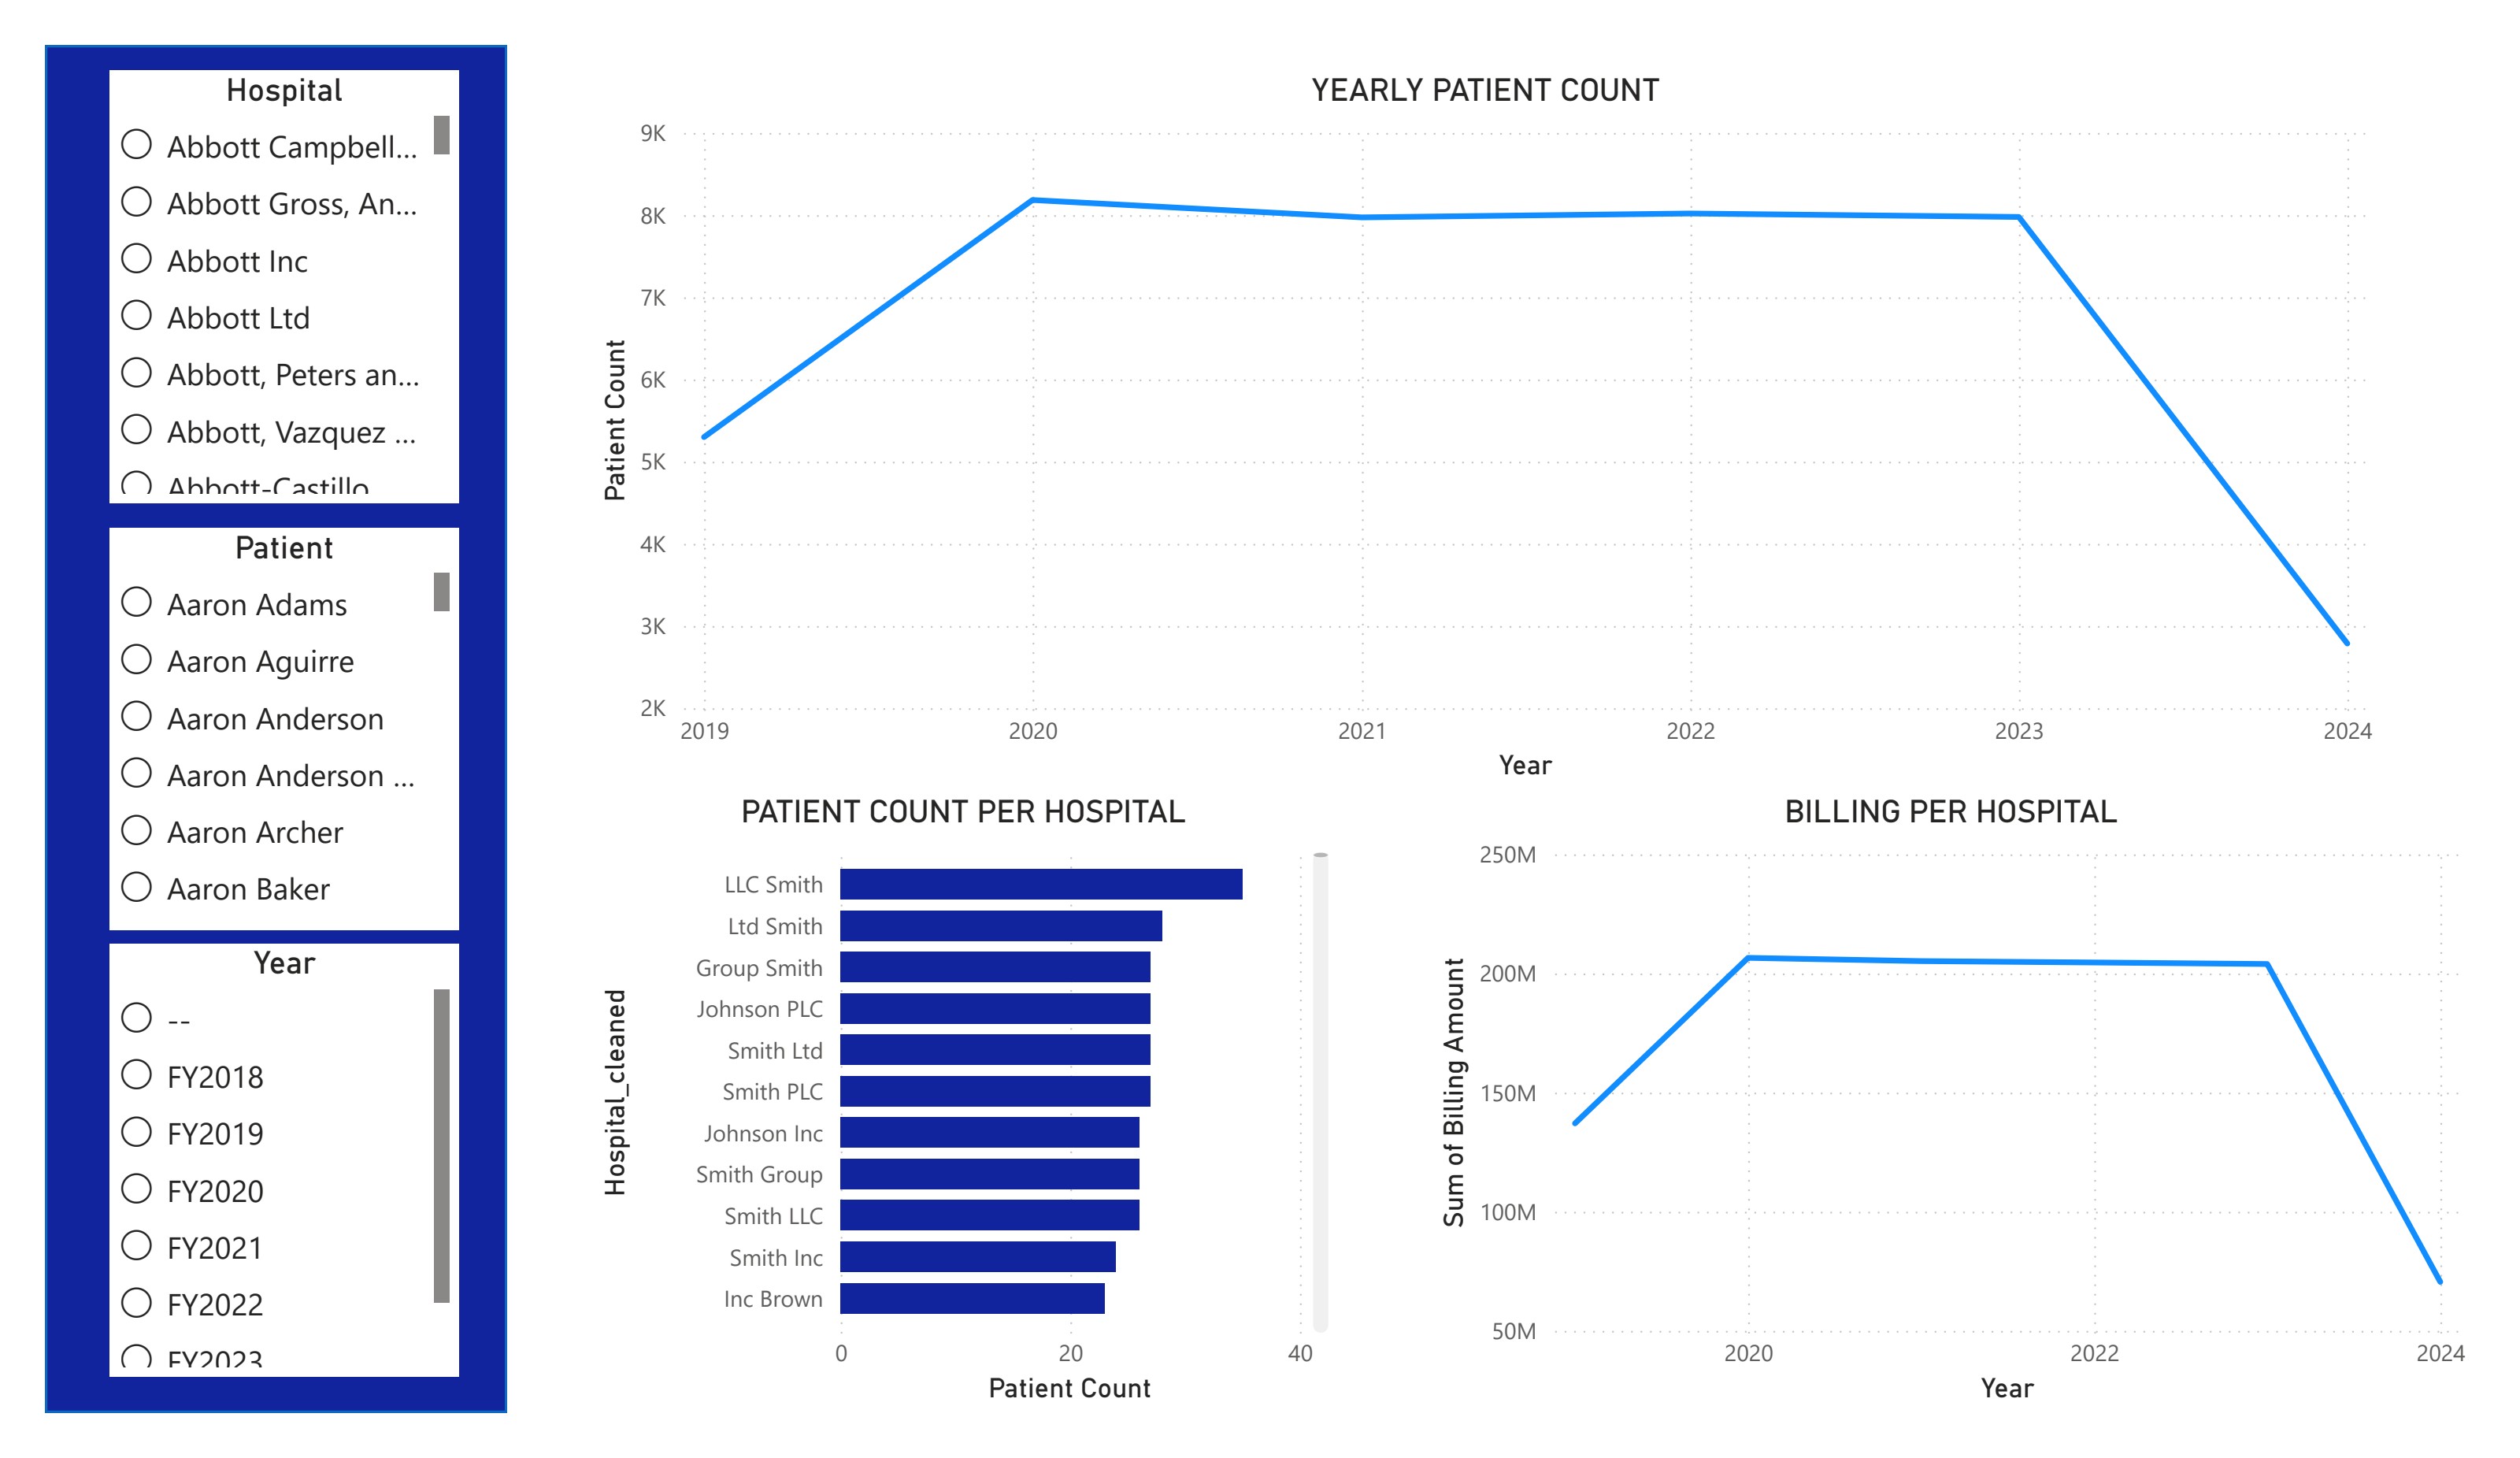
Admissions track billing almost exactly — the FY2024 revenue drop follows a comparable drop in patient volume.
Billing totals by insurance provider
Billing is spread almost evenly across the five providers — roughly 20% share each.
Medical condition share of encounters
Arthritis and diabetes lead, but all six conditions sit within one percentage point of each other.
Dashboard Walkthrough
Findings & Insights
Patient volume drives revenue
Billing, admissions, and medication distribution move together. All three climbed into FY2020, held steady through FY2023, and then fell by more than half in FY2024 — pointing to volume, not pricing, as the primary revenue lever.
Denied claims are an escalating cost
Billing minimums trend further into negative territory year over year since 2021, peaking in 2022, while billing maximums stay flat near $52K. Denials quietly erode revenue that hospitals either absorb or chase through patients and collections.
Seniors dominate utilization
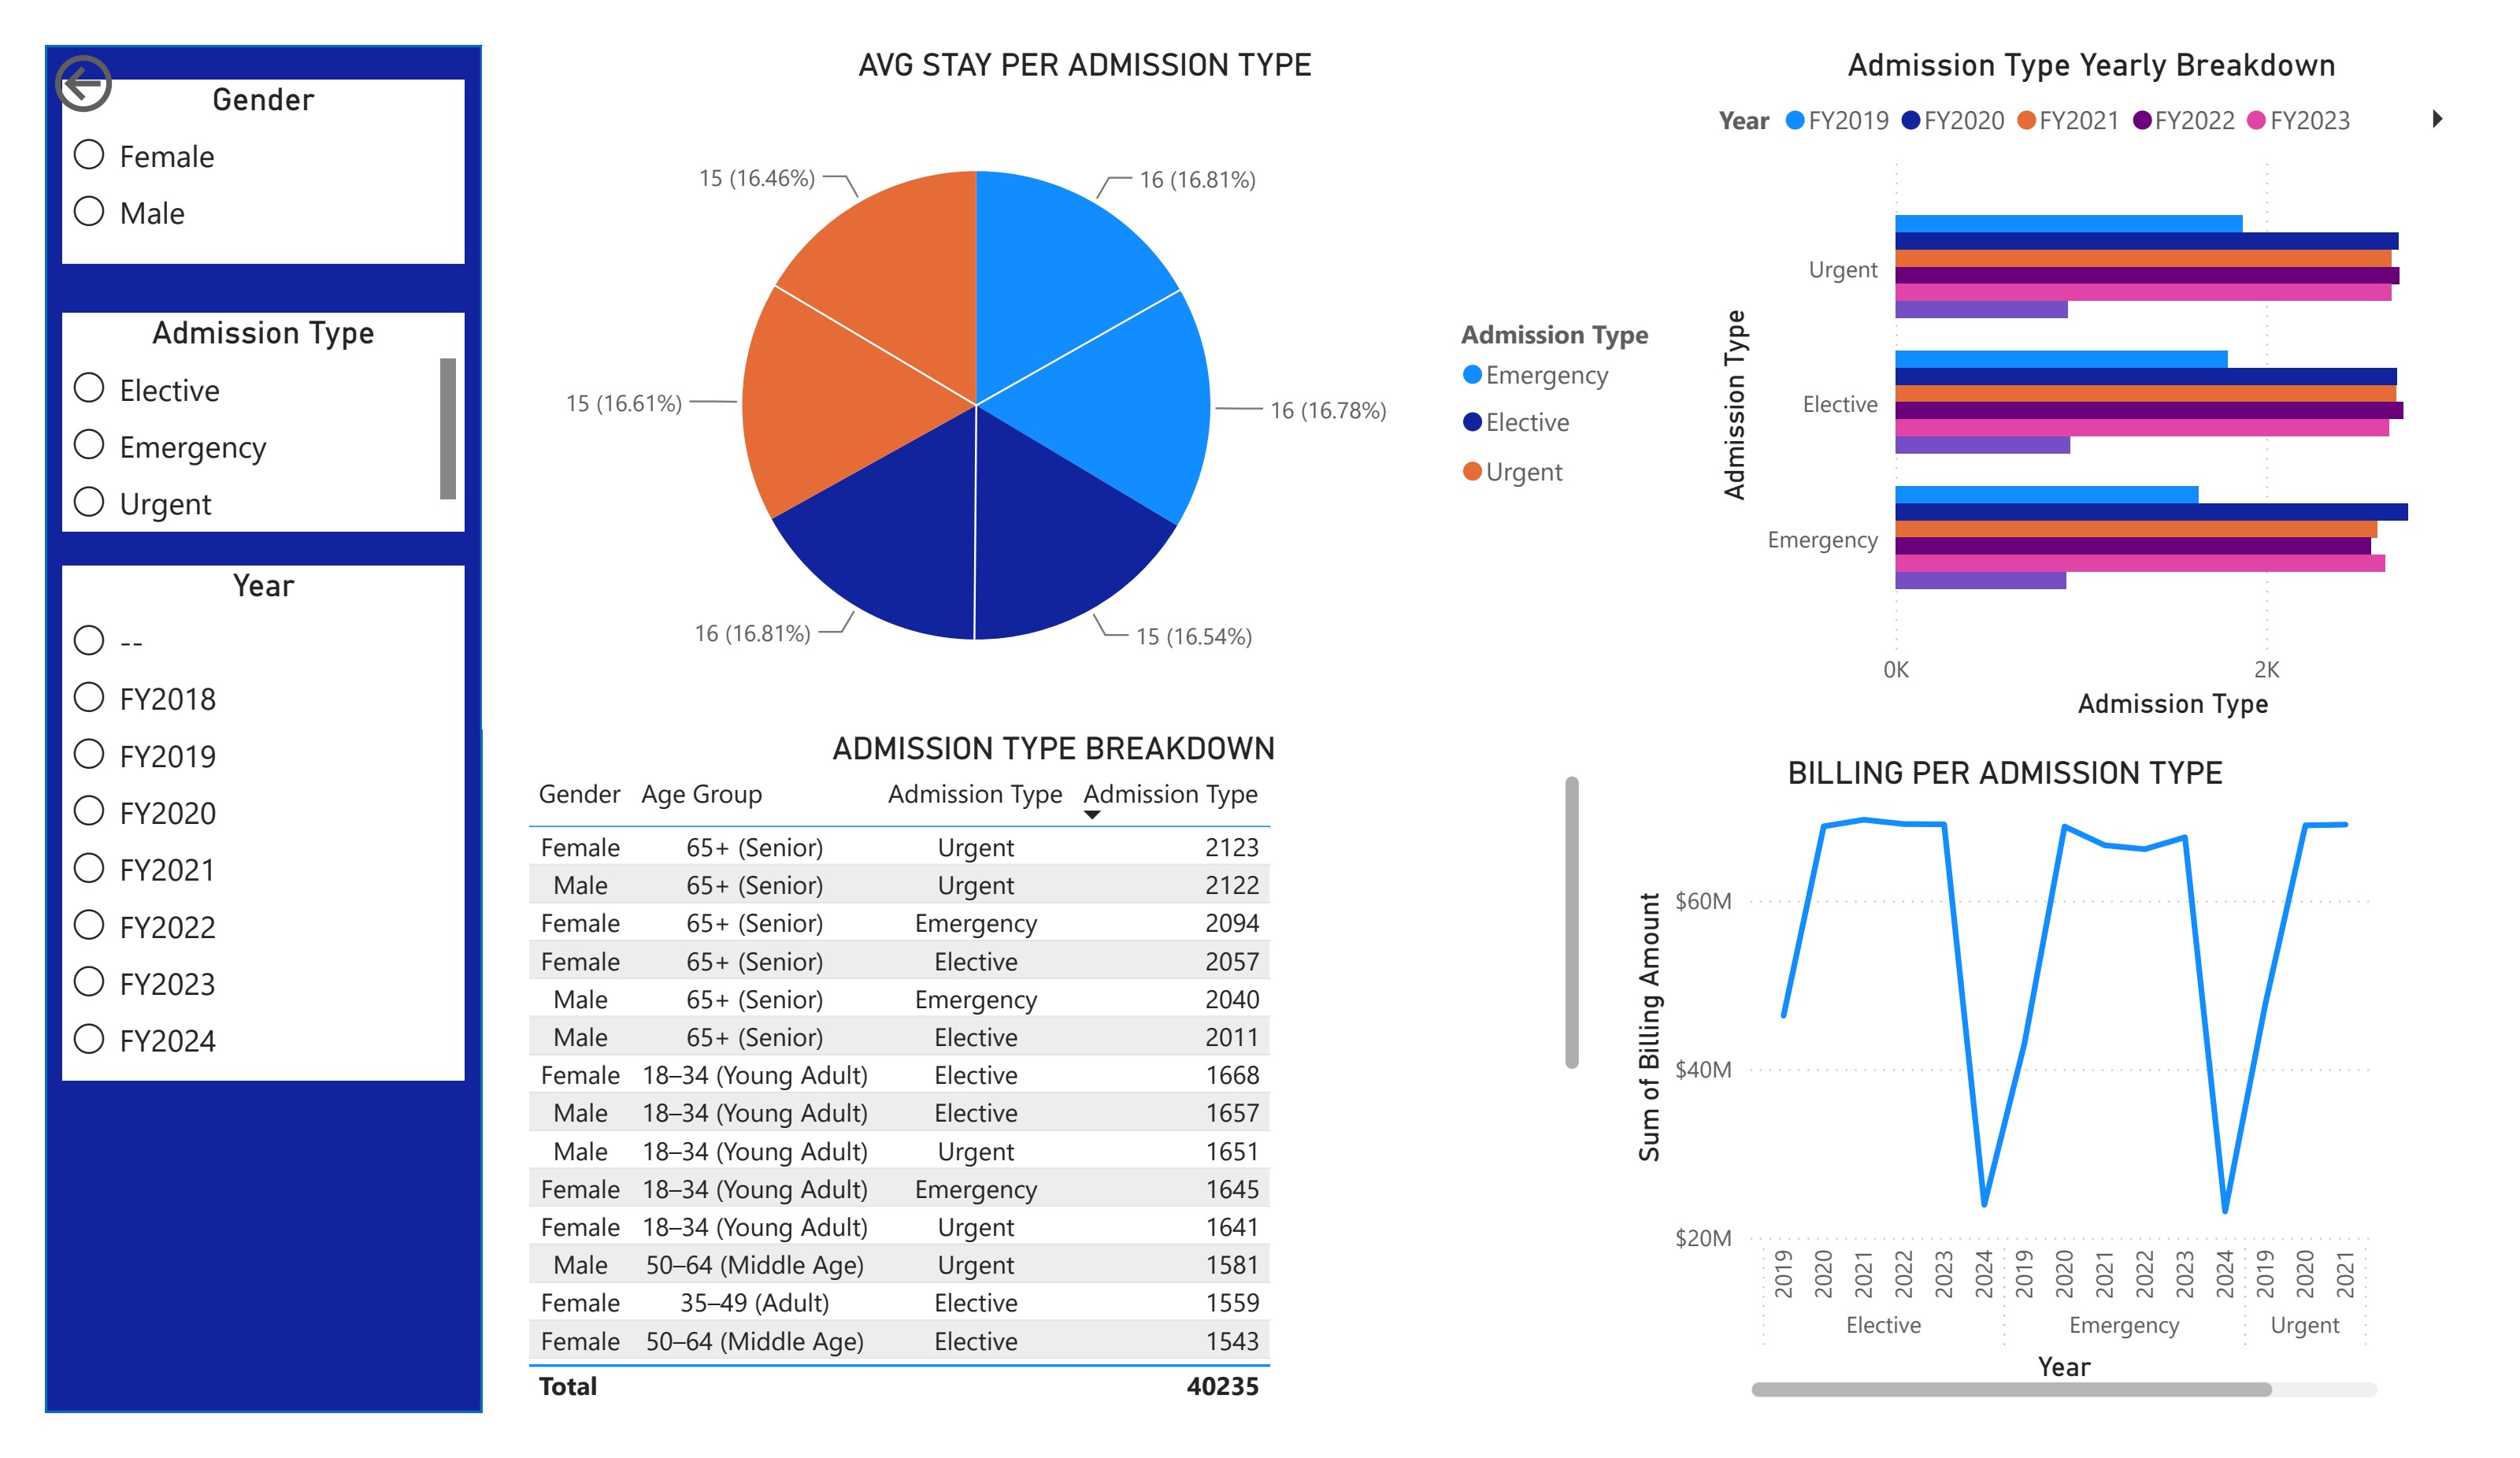
Patients 65+ account for the most visits across all three admission types, followed by young adults (18–34). Elective and urgent visits make up the majority of admissions; emergency is the smallest share.
Condition mix is broad, not concentrated
Arthritis and diabetes are treated most often, but the six tracked conditions are nearly evenly distributed. Arthritis leads among male children, female young adults, and seniors; diabetes leads among middle-aged adults.
Length of stay is uniform
Average stay is 15–16 days regardless of admission type or hospital, suggesting discharge practices are standardized rather than driven by acuity.
No outlier hospital on abnormal labs
One hospital recorded the highest count of abnormal test results, but only by a small margin — abnormal rates are consistent across facilities and physicians.
Recommendations
- Build a patient services pipeline that verifies insurance coverage and evaluates medical services before the visit, with a dedicated rep acting as SME per insurance provider so patients are alerted proactively when policy or billing structures change.
- Treat upfront staffing cost as a denial-prevention investment — it removes back-end claim denials and creates billing transparency between patients and providers.
- Stand up specialty departments serving seniors and young adults, with treatment units focused on pain and dietary management to match the arthritis and diabetes mix.
- Pair billing policy changes with community-based marketing to rebuild visibility and trust, and run further analysis on FY2024 to isolate whether the decline stems from denials, utilization, or care-model change.
Results & Findings
The analysis answered all ten stakeholder questions and traced the FY2024 revenue decline to patient volume rather than pricing, while isolating claim denials as a separate, growing drag on margin. Findings were delivered as a six-page Power BI report plus a written summary with recommendations for a pre-visit insurance verification pipeline and senior/young-adult specialty units.